Flat vs National Hunt vs All-Weather: How UK Race Types Differ on the Racecard
Best Horse Racing Betting Sites – Bet on Horse Racing in 2026
Loading...
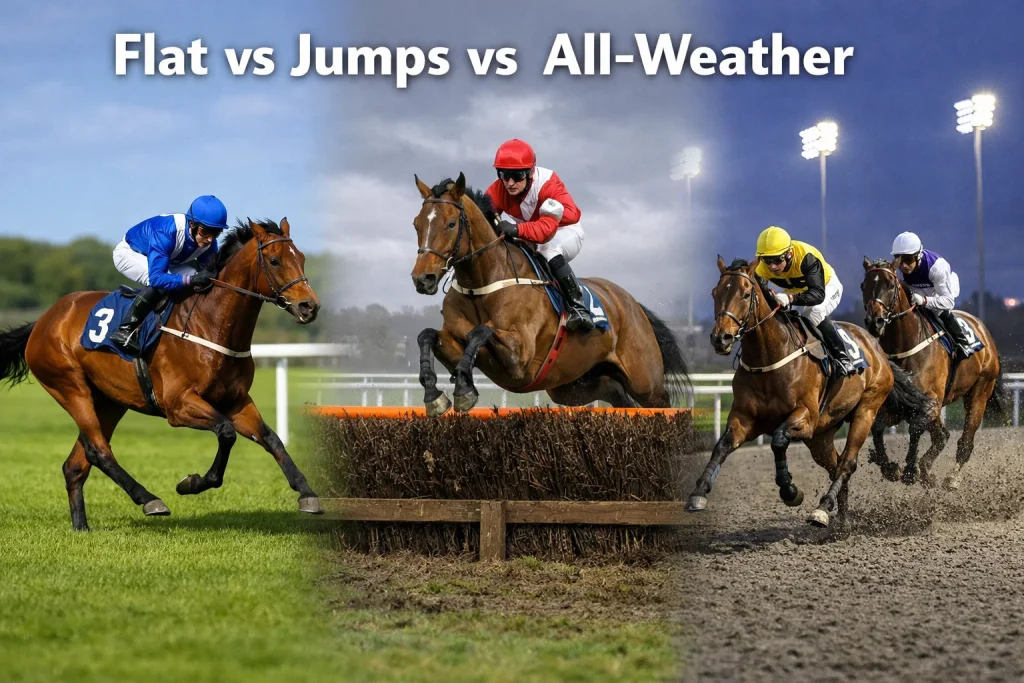
British racing operates under three codes — Flat, National Hunt and all-weather — and each one produces a racecard that looks broadly similar but reads quite differently. The columns are the same: runner name, form, weight, jockey, trainer, odds. The information those columns carry, however, shifts in emphasis depending on which code you’re looking at. On a Flat racecard, the draw column is critical. On a National Hunt card, it’s irrelevant. On an all-weather card, the going description follows a different scale entirely.
Knowing which code you’re reading changes how you weight every piece of data on the card. A form figure of “3” in a Group 1 on the Flat means something different from a “3” in a Grade 1 novice chase. A horse carrying 9st 7lb in a Flat handicap is operating under a different system from one carrying 11st 4lb over fences. Even the season matters — Flat racing peaks in summer, National Hunt dominates winter, and all-weather fills the gaps year-round.
This guide profiles each code through the lens of the racecard: what’s unique, what’s shared, and what the punter needs to adjust when switching between them. It then covers the class and grading system that applies across all three codes, examines field-size and prize-money trends from the latest BHA data, and finishes with practical guidance on choosing which code suits your approach as a racecard reader.
Flat Racing: Speed, Turf and the Summer Calendar
Flat racing is the code most people picture when they think of British horse racing — Thoroughbreds running at full speed on turf, without obstacles, across distances ranging from five furlongs to two and a half miles. The turf Flat season runs from approximately April to November, with the showpiece meetings concentrated in summer: the Guineas at Newmarket in May, the Derby at Epsom in June, Royal Ascot in June, Glorious Goodwood in late July, and the St Leger at Doncaster in September.
On a Flat racecard, several elements carry heightened importance. The draw column is exclusive to the Flat — horses start from numbered stalls, and at certain courses (Chester, Beverley, Windsor), the stall number has a measurable impact on the result. National Hunt races don’t use stalls, so this column is absent from jump cards. When you see a draw number on the card, you’re reading a Flat fixture.
The age column matters more on the Flat than in any other code. Two-year-old racing is a Flat-only phenomenon — juvenile horses are too immature to jump obstacles safely. The weight-for-age scale adjusts for the rapid physical development that occurs between age two and age four, and a three-year-old running against older horses in June receives a different allowance from one doing the same in October. Reading the age alongside the weight on a Flat card tells you whether the horse is receiving a maturity advantage or conceding one.
Flat racing is also where speed and class intersect most sharply. Races are shorter and faster than over jumps, which means small margins matter more. A horse’s finishing position in a six-furlong sprint can be separated by a neck from first to third, while the same trio in a three-mile chase might be spread across ten lengths. The form figures on a Flat card tend to cluster more tightly, making it harder to separate runners on form alone and increasing the importance of secondary factors like going, draw and jockey booking.
The BHA’s investment in making top-level Flat racing more competitive is reflected in the data and the racecards. As Richard Wayman, BHA Director of Racing, explained: “We wanted to make our best racing better and use that as our tool to grow interest in the sport. Part of that was making the racing as good as we could, so we invested in the racing and we have seen a real upside on that.” That investment shows in the field sizes at Premier Flat meetings, which averaged 11.02 runners in 2026 — significantly above the overall Flat average of 8.90. On a Flat racecard at a Premier fixture, you’re looking at deeper, more competitive fields than at any other level of British racing.
The Flat horse population has been relatively stable. According to the BHA Racing Report for 2026, the number of individual horses competing on the Flat rose by 0.5% year on year — a modest but positive trend that contrasts with the decline on the jumps side. For the racecard reader, this means Flat cards continue to offer strong field sizes and reliable form lines built on a consistent pool of runners.
National Hunt: Jumps, Stamina and the Winter Game
National Hunt racing — the jumps — is the other great pillar of British racing. It runs primarily from October to April, with the Cheltenham Festival in March and the Grand National meeting at Aintree in April as its defining events. The code is built around obstacles: hurdles (smaller, brush-topped barriers) and fences (larger, stiffer, with a ditch on the takeoff side for some). There is also the National Hunt Flat race, known as a bumper, where jump-bred horses race without obstacles as an introduction to the code.
On a National Hunt racecard, the most immediate difference from the Flat is the absence of a draw column. Horses start behind a tape rather than from numbered stalls. There is no stall-based advantage or disadvantage. The field lines up and the tape goes up. This removes one entire variable from the racecard analysis. In its place, the going column becomes even more consequential. Soft and heavy ground are far more common during the winter jump season than in summer Flat racing, and the energy cost of jumping obstacles on testing ground is significantly higher than galloping on the same surface without them. A horse with form on good ground that encounters heavy going for the first time over fences faces a fundamentally different test.
The weight scale is heavier over jumps. A typical National Hunt handicap ranges from 11st 12lb at the top to around 10st 0lb at the bottom. The higher base weight reflects the longer distances (two miles minimum for hurdles, two and a half miles minimum for most chases) and the physical demands of jumping. The weight column on a jump card carries the same analytical logic as on the Flat — more weight equals the handicapper’s higher assessment — but the actual figures are roughly two stones heavier across the board.
The form figures on a jump card include letters that rarely or never appear on Flat cards. “F” (fell), “U” (unseated rider), “B” (brought down), and “R” (refused) are all jumping-specific non-completions. Their presence tells you something important: this is a code where completing the race is not guaranteed. On the Flat, virtually every horse finishes — the non-completion rate is negligible. Over jumps, especially in novice chases where horses are learning to jump fences at racing speed, the attrition rate is material. A form line that includes one or two non-completions over fences is not unusual and does not automatically disqualify a horse from consideration.
The jump horse population has been shrinking. The BHA’s 2026 data showed a 3.0% decline in the number of individual horses competing over jumps, and average field sizes fell to 7.84 in 2026 from 8.49 the year before. At Premier Jump fixtures the picture is better — an average of 9.41, up from 9.22 — but Core Jump meetings dropped to just 7.63. Smaller fields change the racecard dynamic: with fewer runners, each horse represents a larger share of the betting market, favourites tend to be shorter-priced, and the form lines involve fewer overlapping opponents. On a National Hunt card, you’ll see tighter markets and more predictable form patterns than on the Flat — which is both an advantage (easier to read) and a disadvantage (less value in the prices).
All-Weather: Year-Round Racing on Synthetic Surfaces
All-weather racing fills the calendar gaps that turf racing leaves behind. It runs year-round, primarily at six dedicated UK venues: Lingfield and Kempton (Polytrack), Wolverhampton and Newcastle (Tapeta), Southwell (Fibresand), and Chelmsford (Polytrack). The surfaces are synthetic — designed to drain quickly, resist frost, and provide a consistent racing surface regardless of season or weather. That consistency is the defining feature of all-weather racing and the key difference visible on the racecard.
On an all-weather card, the going column uses a different scale. Instead of the seven-level turf system (Hard through Heavy), all-weather going is described as Standard, Standard to Slow, or Slow. Fast is occasionally used when the surface is riding particularly quick. The range is compressed because synthetic surfaces don’t absorb water the way turf does — heavy rain runs off rather than soaking in, so you’ll never see “heavy” on an all-weather card. This compressed going scale means the surface is less of a differentiator between runners. Horses that struggle on extremes of turf going — those that hate heavy ground, for example — may find all-weather surfaces more accommodating.
The surface type matters more than the going description. Polytrack, Tapeta and Fibresand are distinct materials with different characteristics. Polytrack is a wax-coated blend of silica sand, fibres and recycled rubber. Tapeta is a proprietary mix of silica, wax and fibres designed for deeper cushioning. Fibresand (used only at Southwell) is sand mixed with polypropylene fibres and plays heavier — closer to soft turf in its demands on a horse’s stamina. Some horses thrive on Polytrack but struggle on Fibresand, and vice versa. The racecard tells you the course; you need to know which surface that course uses and check each runner’s record on it.
The draw exists on all-weather cards because these are Flat races run from stalls. At some all-weather venues — notably Newcastle’s straight course — draw bias is significant. At others (Kempton, Wolverhampton), the bias is minimal or distance-dependent. All-weather draw data is generally more consistent than turf data because the surface doesn’t change with the weather, which means historical patterns are more reliable as predictive tools.
All-weather form sits slightly apart from turf form in the broader racecard ecosystem. Horses that dominate on synthetic surfaces don’t always transfer that ability to turf, and elite turf performers sometimes underperform on the all-weather. When you see a runner with a form line built entirely on all-weather surfaces entered in a turf race — or the reverse — the form figures need to be read with that surface switch in mind. The racecard shows you the course and the form, but it doesn’t flag the surface mismatch. That’s on you.
Race Classes and the Grading System
The class system spans all three codes and provides the quality framework that sits behind every racecard header. Understanding it is essential because class determines the calibre of competition, the prize money, and — in handicaps — the range of official ratings eligible to run.
Class 1 is the pinnacle. On the Flat, it includes Group 1, Group 2, Group 3 and Listed races. Over jumps, the equivalents are Grade 1, Grade 2, Grade 3 and Listed. These are the races contested by the best horses in the country (and often the best from overseas). Entry is typically by invitation, qualification, or supplementary entry fee. On the racecard, a Class 1 header signals elite competition where form figures should be read at face value — a “3” in a Group 1 is a high-class performance.
Class 2 covers the next tier: valuable handicaps and conditions races below Listed level. Horses here are rated typically between 86 and 105. The prize money is substantial, the fields are competitive, and the form is generally reliable because the horses are experienced and consistent. Class 2 handicaps are popular betting races — competitive enough to produce interesting prices but not so chaotic as to be unreadable.
Classes 3 and 4 represent the solid middle of the sport. Rating bands for Class 3 are approximately 76 to 95; for Class 4, 66 to 85. These classes contain the majority of handicap racing in Britain and produce the bulk of competitive, analysable racecards. Trainers frequently target Class 3 and 4 handicaps with improving horses, so the form lines often include horses on upward trajectories whose ratings are about to be reassessed.
Classes 5, 6 and 7 cater to the lower end of the rating scale — horses rated below 70, and in Class 7, below 50. These races offer smaller prize purses and tend to attract less experienced or lower-ability runners. The form at this level is often inconsistent because the horses are less reliable. For racecard readers, the lower classes demand more caution — the form figures are real, but the horses producing them are more likely to run to wildly different levels on different days.
The investment gap between tiers was evident in 2026. According to the BHA Racing Report, prize money at Premier Racedays increased by £7.33 million, while Core-level fixtures saw a decline of £3.64 million. That financial divergence means the racecards at Premier meetings attract deeper fields and stronger form, while Core-level cards are competing for a smaller share of prize money and, consequently, a smaller share of the horse population. The class shown on the racecard header tells you which tier of this financial ecosystem you’re operating in.
One practical note: class and official rating don’t always align perfectly. A horse rated 90 might run in Class 2 (where it’s near the bottom of the range) or Class 3 (where it’s near the top). The competitive dynamics differ — the same horse faces tougher opposition at the top of a higher class. The racecard shows both the class and the rating. Reading them together tells you where the horse sits relative to its rivals, which is more useful than either figure alone.
Field Size and Prize Money Trends Across Codes
The number of runners on a racecard and the prize money in the header are not decorative figures. They reflect structural trends in British racing that directly affect how competitive each race is and how readable the form behind it turns out to be.
The field-size figures cited in the code profiles above — 8.90 on the Flat, 7.84 over jumps, 11.02 at Premier Flat meetings — are not isolated snapshots. They represent the latest point in a sustained downward trend that has been reshaping British racecards for several years.
On the Flat, the average has fallen from 9.14 in 2026 to 8.90 in 2026. Over jumps, the drop was steeper — from 8.49 to 7.84. Only Premier Flat meetings gained ground, rising from 10.86 to 11.02. The divergence tells a clear story: the best-funded fixtures are holding their ground, while the broader programme is thinning as the horse population contracts.
For racecard readers, smaller fields change the calculus. Fewer runners mean less market uncertainty, shorter-priced favourites, and tighter form lines with more overlapping data between runners. A seven-horse jump race offers less room for surprise than a twelve-horse Flat handicap. The racecard’s field size is a complexity indicator — larger fields demand more work and tolerate more speculation, while smaller fields reward disciplined form reading and penalise wild punts.
Prize money reached a record £194.7 million in 2026, funded from three main sources: the Horserace Betting Levy Board (£63.3 million, up 4.7%), racecourses (£103.3 million, up 2.6%), and owner contributions (£26.8 million, up 3.1%). The record total is positive for the sport, but the distribution is uneven. Racecards at top-tier meetings show prize funds of £50,000 to £500,000 and above. Racecards at lower-tier fixtures might show £4,000 to £8,000. The prize money on the card tells you how much owners and trainers have invested in preparing their horses — because the economics of racing mean it costs more to keep a horse in training than most lower-class races pay out. A horse entered in a £5,000 race is either there because the trainer thinks it can win, or because the owner wants a day out. The prize figure helps you distinguish between the two.
The trends interact. As the horse population declines — 18,452 individual runners in 2026, down 1.0% from 2023, and just 21,728 horses in training in 2026 (down 2.3%) — the BHA has fewer horses to spread across the fixture list. The pipeline is thinning further: British breeders produced just 4,015 foals in 2026, the lowest figure in twenty years. BHA modelling forecasts that the number of runs in Britain by 2027 will be 6 to 7% lower than in 2026. Field sizes contract, particularly at lower levels. Prize money gravitates upward, toward the fixtures that justify the cost of participation. The racecard reflects all of this: bigger fields and higher stakes at Premier meetings, leaner fields and tighter margins at Core and grassroots level. Where you choose to focus your racecard reading depends on what kind of contest you’re looking for.
Choosing Your Code as a Punter: What the Card Reveals
Each code rewards a different analytical temperament, and the racecard is the document that tells you which temperament is being tested on any given day.
If you’re drawn to data-driven analysis — draw statistics, speed figures, weight differentials, going coefficients — the Flat is your natural territory. Flat racecards offer the most measurable variables: stall positions, tight finishing margins, weight-for-age calculations, and a horse population large enough to generate statistically significant patterns. The draw column alone opens an analytical dimension that doesn’t exist over jumps. Premier Flat meetings, with their deep fields and high-quality form, are the richest environment for systematic racecard reading.
If you prefer narrative form reading — following a horse’s career arc, understanding how it handles different obstacles, assessing whether a young chaser has learned to jump — National Hunt offers a richer storyline. Jump racecards are shorter in terms of field size but longer in terms of what each runner’s history contains. Non-completions, obstacle-specific form, going extremes, and the physical demands of the code create more complex form lines that reward patient study. The smaller fields also mean you need to assess fewer runners in depth, which suits punters who prefer quality of analysis over breadth.
If you value consistency and frequency, all-weather racing delivers. Meetings run year-round, often in the evening and midweek, with form lines built on surfaces that don’t change with the weather. The going is predictable. The tracks are fewer in number, so historical data is concentrated and relatively reliable. All-weather cards are well suited to punters who want to develop expertise at specific venues — learning Newcastle’s straight-course draw bias or Lingfield’s Polytrack tendencies — and apply that knowledge across a high volume of fixtures.
None of these profiles is inherently superior. The best racecard readers are comfortable switching between codes and adjusting their approach to match what the card shows them. The header tells you the code. The columns tell you which factors matter most. The anchor phrase — on a Flat card, you’ll see the draw; on a jump card, you’ll see obstacle form; on an all-weather card, you’ll see surface consistency — is the starting point. What you do with it is the analysis.